Today, you are going to Six Flags Great America in Gurnee, Illinois to ride some virtual roller coasters. We will do research and make a slide show of all these fun rides. Let's go!!
Part 1: Google Form
Time to learn more about these thrilling roller coaster rides. Click on the link below to open the Google Form. Then, open a new tab and do a Google search for the answers. Ready, set, go!!

Part 2: Google Sheets
First, let's learn how fast these coasters go. Click on the links below to to find out how many miles per hour each one travels. Then, open a new tab and make a table and graph depicting this information. Ready, set, go!!
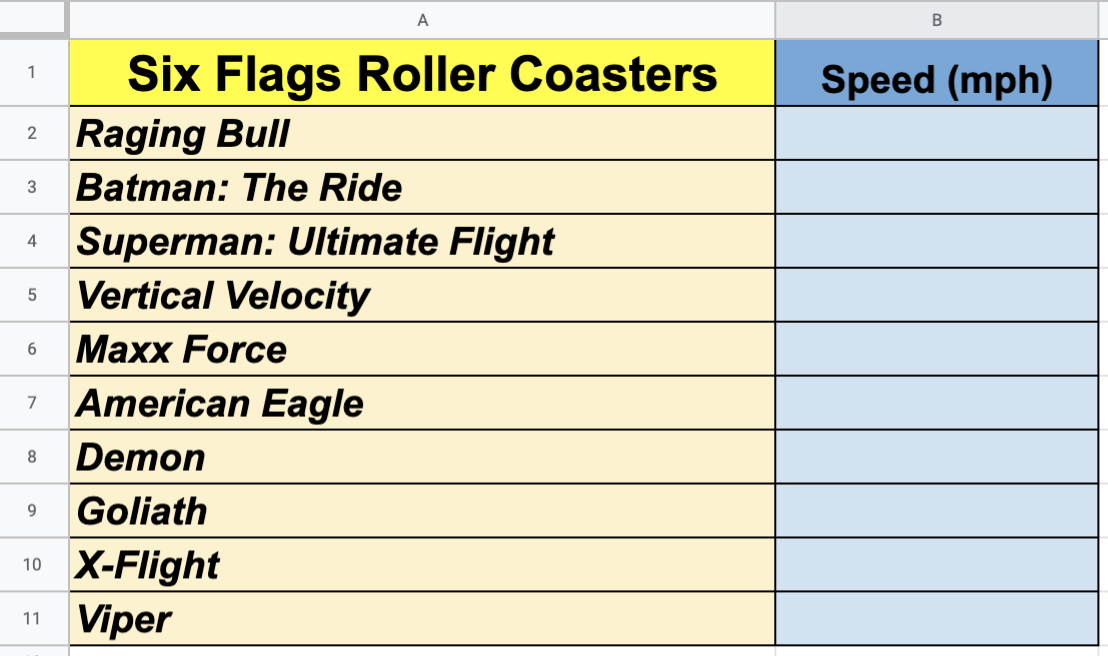
Make a Table in Google Sheets
First, type in the roller coaster names in Column A.
Second, type in the roller coaster speeds in Column B.
Example:
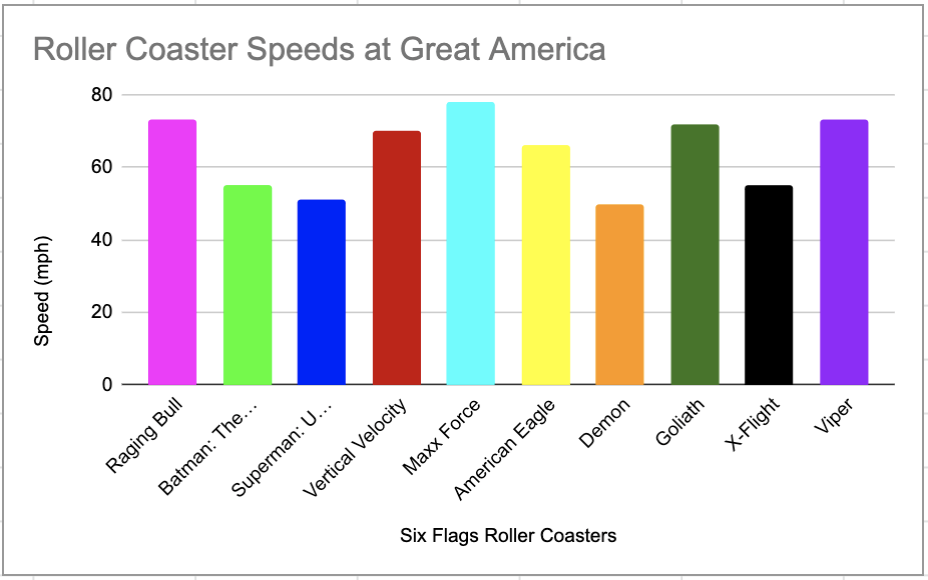
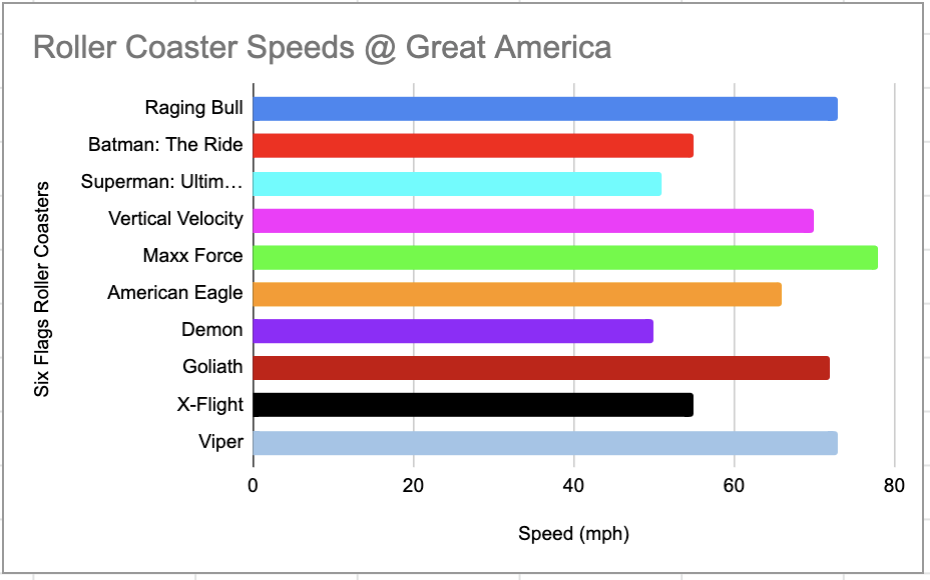
Roller Coaster Speeds @ Great America
Click the rides below to find the miles per hour.
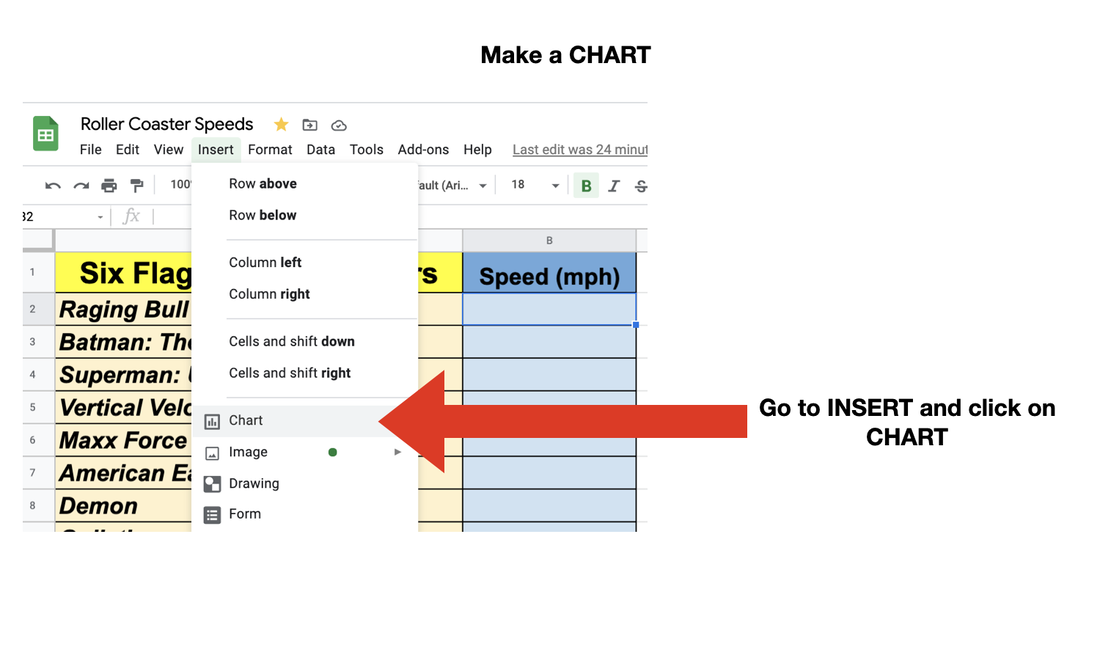
Make a Graph on Google Sheets
First, highlight your table with your mouse. (Highlight all the data including rides and speeds)
Then, go to the toolbar and click on INSERT and CHART.
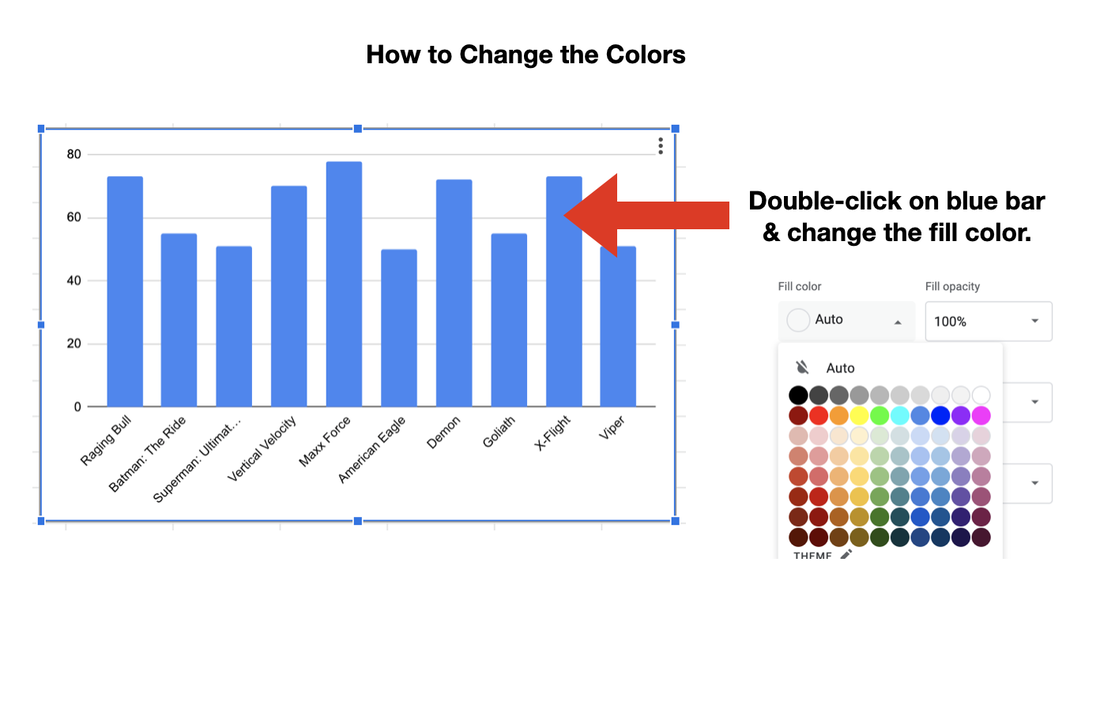
Change Colors of Chart
Double-click on the blue bar in the graph and choose FILL COLOR.
|
|
Part 3: Google Slide
Use Google Slides to present your favorite roller coaster. Here are requirements for your presentation:
Presentation Requirements:
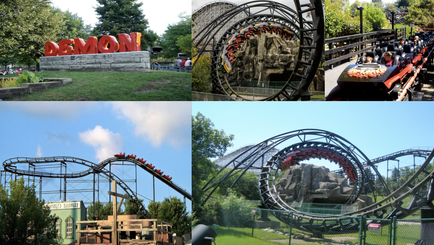
Slide #1: Make a Picture Collage
Slide #1: Make a Picture Collage
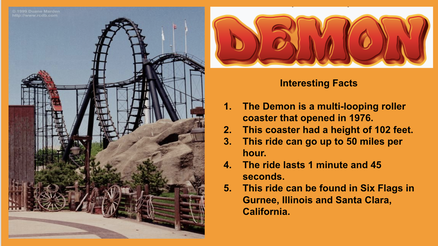
Slide #2: Research 5 Interesting Facts
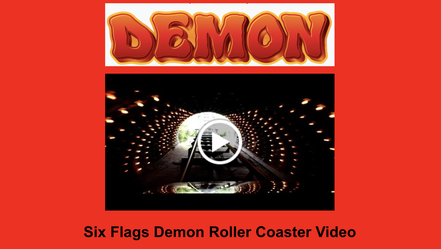
Slide #3: Extra Credit: Insert a Video
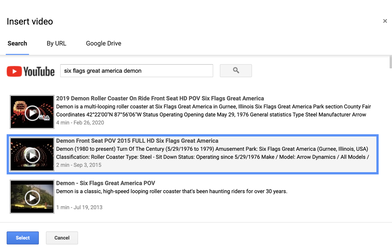
Go to Insert in the toolbar and click on Video.
|
Slide #3
|
BE CREATIVE. Change the theme, background, and font. Insert word art, shapes, and use clipart from the web. You can also insert slide transitions and animations to enhance your presentation.
Part 4: Games
Directions: After you finish your work, you can play the games below.
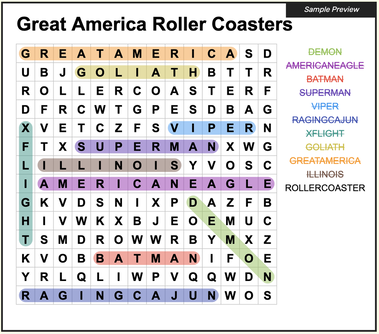
Word Search
Roller Coaster Kahoot
More Games